Audit and assessment
I analyse your installed base, support arrangements or data quality to identify gaps and define priorities.
An assessment and a prioritised action plan.
AY ENGINEERING & SERVICES · INDEPENDENT CONSULTANCY
As a CMRP® certified reliability consultant, I help industrial companies maintain and support their assets through standards-based methods and tailored solutions.
Avionics · Rail · Electrical energy
An initial 30-minute discussion, with no obligation. Confidentiality assured.

LIFE CYCLE RISK ANTICIPATION
λ(t)Normalised illustrative model · synthetic imagery · no client data
Services
I tailor my services to your needs, from a focused assignment to ongoing support, with a scope and outcomes defined together.
I analyse your installed base, support arrangements or data quality to identify gaps and define priorities.
I assess equipment reliability and availability, ageing-related risks, spare parts requirements and life cycle costs.
I help your teams structure reference data, management rules and tools for monitoring maintenance and support.
AREAS OF EXPERTISE
Decision
Asset and maintenance task prioritisation.
Deliverable
Failure analysis, reliability model and maintenance plan informed by reliability-centred maintenance (RCM).
Sustained equipment performance during operation.
Decision
Trade-offs between repair, replacement and preventive maintenance.
Deliverable
Maintenance plan, availability indicators and action plan.
Life cycle support resource planning.
Decision
Support resource sizing and cost comparison.
Deliverable
Life cycle cost (LCC) analysis, spare parts requirements and support data.
Anticipation of support withdrawals and component shortages.
Decision
Selection of a monitoring, stockholding or replacement strategy.
Deliverable
Obsolescence management plan using IEC 62402 and repairability register.
Transformation of scattered data into usable information.
Decision
Identification of data corrections for decision-making.
Deliverable
Source inventory, data flow mapping, quality audit and prioritised action plan.
LABORATORY
Three learning exercises based on simplified assumptions, for illustration rather than design sizing.
A = MTBF / (MTBF + MTTR)
Steady state; excludes logistics delays and preventive maintenance.
OPEX / CAPEX
Break down annual operating and support expenditure, including estimated hidden costs and cumulative costs over the selected period.
Downtime impact : €3,000/year
Inventory carrying cost : €500/yearStorage, insurance, tied-up capital and stock write-offs; exclude already counted items.
Avoid double counting: exclude parts and labour already covered by a contract. For downtime, use lost contribution margin or service value per hour, allowing for any catch-up, rather than gross revenue.
Initial values are illustrative. Enter annual amounts for the same asset or installed base throughout. Lost margin is an economic impact, not an additional accounting expense.
Import an installed population and its failure history to calculate observed MTBF and survival to first failure.
.xlsx format, maximum 2 MB. Up to 5,000 assets and 10,000 failures.
Your file is processed in your browser. It is neither uploaded nor stored on the site server.
Parametres

Actifs

Pannes
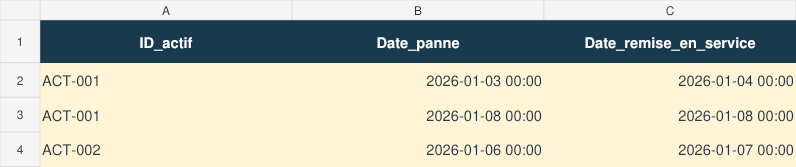
MTBF = cumulative operating exposure / total failures. Kaplan-Meier survival uses each asset’s first failure and right-censors assets still failure-free at the end of observation.
Survival over time, using the shape parameter β and the scale parameter η.
Survival R(t)
R(t) = exp[−(t/η)β]
Mean = η × Γ(1 + 1/β)
Median = η × (ln 2)1/β
Two-parameter model, without repair.
Curve readout : 500 h · R(t) = 77.88 %
The median corresponds to 50% survival. The mean is the model’s average lifetime and may differ from the median.
Expected consumption of one part number and coverage stock over a specified period, using MTBF or failure rate.
Based on the entered MTBF or failure rate
For demand over the entire period
Target stock minus usable stock, with a minimum of zero
Achieved coverage : 95.126 %
Current stock coverage : 0.005 %
Average demand is an expectation, not a guaranteed quantity. Coverage stock is the smallest number of units meeting the target probability.
μ = N × m × λ × T
λ = 1 / MTBF
D = q × X, X ~ Poisson(μ)
Assumptions: independent failures, constant rate, installed population maintained through replacement, fixed consumption per failure. No replenishment or repair returns during the period.
Obsolescence application: end-of-life stock sizing over the remaining operating period under these assumptions. The Poisson model does not predict ageing or end-of-life dates.
Electronic component lifecycle lookup using its manufacturer part number and manufacturer.
Source: Octopart / Nexar. Status availability depends on the information provided for the component.
REFERENCE FRAMEWORKS
Frameworks, editions and applicability defined for each assignment.

I am an independent CMRP® certified consultant specialising in reliability, maintenance and support for industrial assets.
My approach combines reliability analysis, support constraints and data analysis to inform your maintenance, inventory and asset renewal decisions.
FIRST DISCUSSION
Your asset, main challenge and timeframe: the key inputs for an initial discussion.